January East Bay Market Analytics
Real Estate

Real Estate
As your local real estate experts, we feel it’s our duty to give you, our valued client, all the information you need to better understand the complex East Bay real estate market. Whether you’re buying or selling, we want to make sure you have the best, most pertinent information, so we’ve put together this monthly analysis breaking down specifics about the market. It’s all part of our mission to give you the very best in personalized service. We would love to know what you think!
Happy New Year and welcome to our January newsletter. This month, we’ll help you make informed real estate decisions and offer you some important information on how the number of days a listing stays on the market impacts buying and selling strategies. Understanding how long it takes for a home to sell in your local market is crucial to maximizing value in negotiations and in making sure you close on the home you want. With that in mind, this month we’ll examine the following:
End of Year Market Updates for the East Bay
Next month’s newsletter will include a full review of your local housing market in 2019 and will offer our predictions for 2020. For now, let’s take a look at the end of the year housing market in the East Bay across three key indicators: home prices, month’s supply, and the sales-to-list price.
Home Prices
In 2019, single-family home prices remained flat in both Alameda and Contra Costa counties. In general, flat prices signal a balanced demand for housing and encourage sellers to price their homes in line with comparables. Condo prices, which historically have fewer sales and greater volatility, showed mixed results, but prices have also trended in line with the previous year.
Inventory
Months supply of inventory measures how many months it would take for all current listings on the market (including listings under contract) to sell at the current rate of sales. In California’s high-demand market, a balanced supply level is three months, which means there are three months of housing inventory on the market at the current rate of sales. A market with less than three months’ supply of inventory favors sellers.
Inventory levels also remained relatively flat compared to the previous year with no double-digit movement in either direction. Overall, inventory remains very low; since the beginning of 2019, buyers have been entering the market to take advantage of low-interest rates and lower prices.
Sale-to-List Price Ratio
The sale-to-list price ratio reflects the difference between the original list price of the home and the final sale price. Single-family homes typically have higher sale-to-list price ratios than condos. At the end of 2019, most markets were selling close to the original listing price.
Everything You Need to Know About Days on Market (DOM)
Days on market (DOM) measures the total number of days a listing remains active before the seller accepts an offer. Typically, a low DOM signals a strong market favoring sellers, and a high DOM indicates a weak market that favors buyers, although average DOM varies by market. For example, homes generally sell faster in West Coast markets than in Midwest markets.
In California, the average DOM for single-family homes at the end of 2019 was 25 days. That’s down three days from the end of 2018, which indicates the market is moving faster than it was a year ago. Below is the DOM data for November 2019:
DOM for single-family homes is especially low and buyers must make offers quickly and may even need to offer concessions, such as waiving contingencies, to get listings under contract.
DOM is important because buyers and their agents use it as a general measure of which homes are new to the market or “fresh.” Homes typically generate the most interest in the first few weeks on market (or, in fast-moving markets, during the first few days). Fresh listings are perceived as having a lot of potential value since they’ve only been seen by a handful of buyers.
Once a home has above-average DOM, it is considered stale—a negative perception that only gets worse as homes spend longer than 30, 60, and 90 days on the market. In this scenario, buyers generally assume:
Sellers can rely on various strategies to ensure their property doesn’t become stale. One of the most important is pricing the home at fair market value from the outset. Sellers can determine this important number by hiring an experienced and knowledgeable agent; conducting a Comparative Market Analysis (CMA); and knowing the local area’s median home prices, sale-to-list averages, and supply. (You’ll find much of this data in our monthly newsletter.) Another important strategy? Consult with a qualified agent about making any repairs or renovations that may be preventing the home from selling.
Price adjustments, which are common, are an opportunity for buyers to track the property history of stale listings. For example, consider a home that’s been on the market for 94 days, as represented in the chart below. At first glance, the listing looks stale and not worth considering.
However, by examining the property history, a buyer or their agent will notice that the property has only been on the market at its new price of $575,000 for three days. This is an opportunity for a buyer to see the property and evaluate it early at the reduced price.
Local Market Price-Reduction Analysis
The chart below shows how common price reductions were in the East Bay over the last two years.
After several price reductions, a listing can become so stale that it makes sense to withdraw it from the MLS and relist it after a certain period of time has passed. In California, sellers must wait 90 days from the time a listing is withdrawn to list it again—a hard choice for sellers who need to sell their homes quickly. However, this strategy is often successful because it’s common for a home to sell within five days of coming to market as a “new” listing.
How Status Changes Impact DOM
Remember that DOM measures the total number of days a listing is active before an offer is accepted. Once that happens, the escrow process begins. The home is in escrow while financing is secured, inspections are conducted, the title is obtained, and so on. Escrow ends when the buyer gets the keys to the house after the close of sale.
Accepting an offer and moving to escrow pauses the DOM count and changes the home’s status from “active” to “pending” (as illustrated in the Sample Property History chart above). For example, if a home listed on January 1st goes into escrow on January 15th but falls out of escrow 60 days later on March 15th, the property will come back on the market with a DOM count of 15 days (i.e. only the days it was on the market prior to escrow). The status also changes back to “active,” meaning the house is no longer under contract.
How Time of Year Impacts DOM
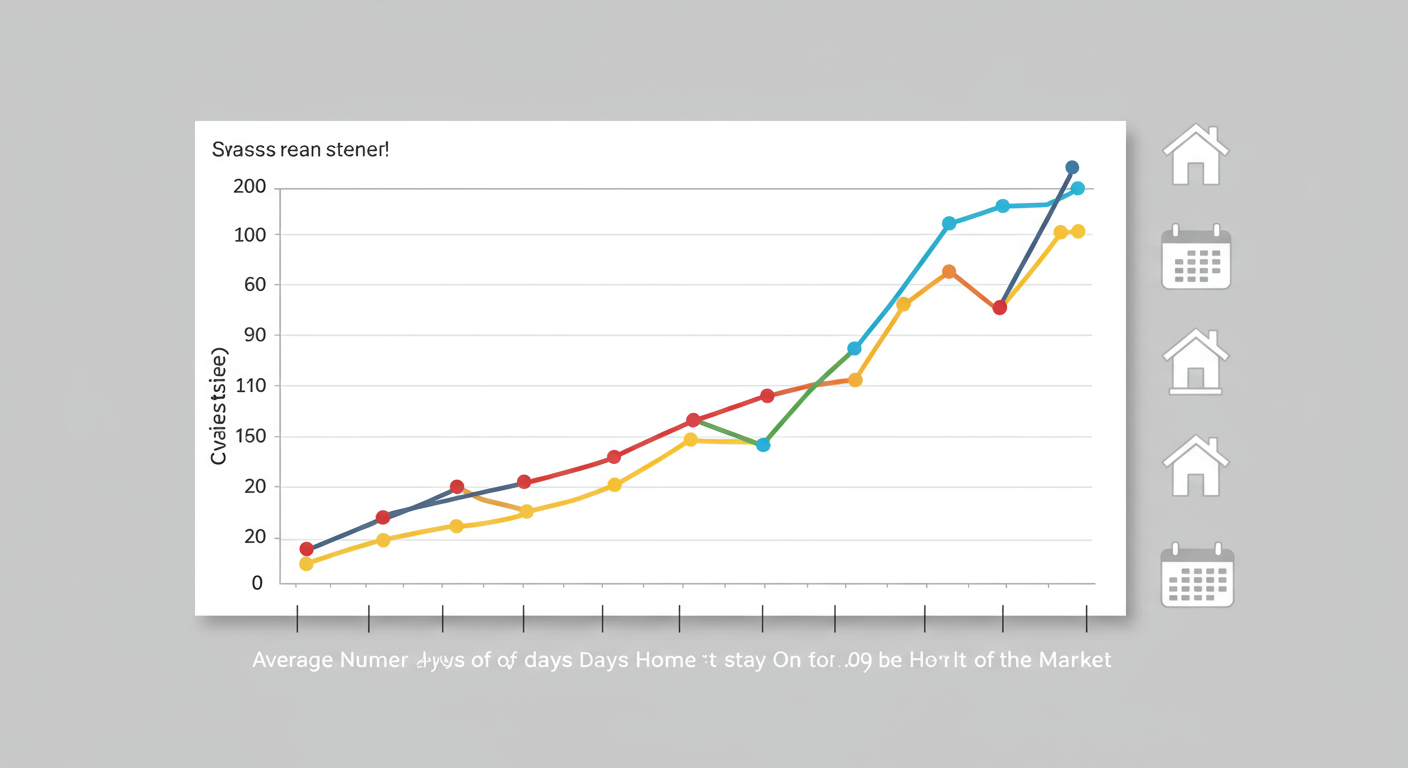
Average DOM fluctuates based on the time of year. To see an example of this, let’s look at the DOM data from the last 24 months.
In the winter months, DOM is significantly higher because the seasonal nature of the real estate market favors the summer months. The DOM rate is higher in the winter because buyers and sellers prefer to move during warmer weather, they often time a move to coincide with the end of the school year, and they opt not to move during the holidays. With less competition, the slow winter season gives buyers the chance to find a good deal on homes that have been on the market for longer than average. With this in mind, potential sellers should be cautious about when they list their homes as there is also a smaller pool of buyers in the winter months.
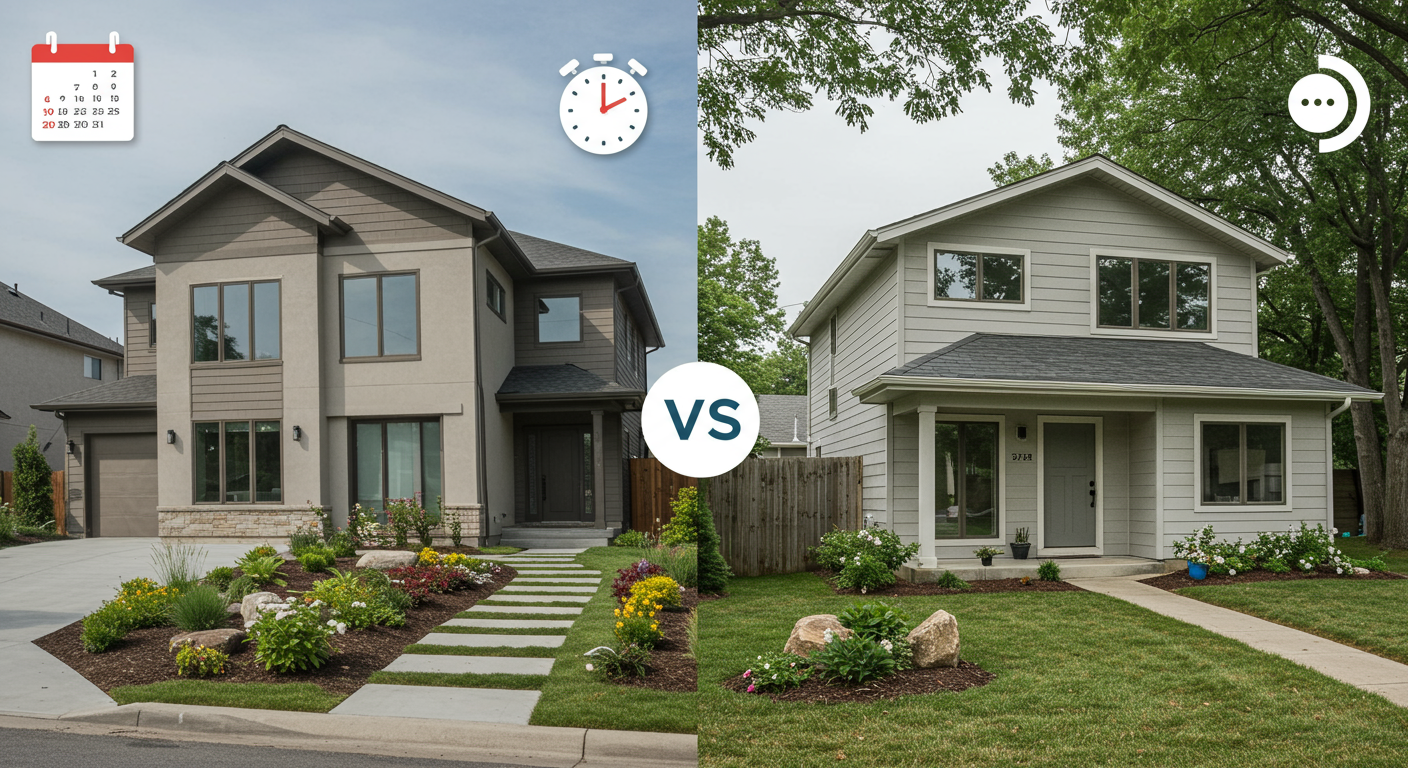
DOM Differences Between Luxury and Starter Homes
Average DOM differs depending on price segment. There are several reasons why luxury homes generally have a higher DOM than more affordable, entry-level homes. First, there are fewer buyers with the income necessary to afford luxury homes. Second, luxury homes are often harder to compare and take longer to evaluate in terms of their market value. Third, buyers looking for investment properties to purchase and then rent out are more active in the entry-level home segment than in the luxury market.
Let’s look at the DOM data from December 2019 based on price segment.
In the East Bay, luxury homes priced over $1.5 million took more than 50% longer to sell than homes in the more stable price segment of under $1.5 million. Because most agents specialize in different price segments and the process is different for each category, it’s important to work with an agent who has experience buying or selling in your price range.
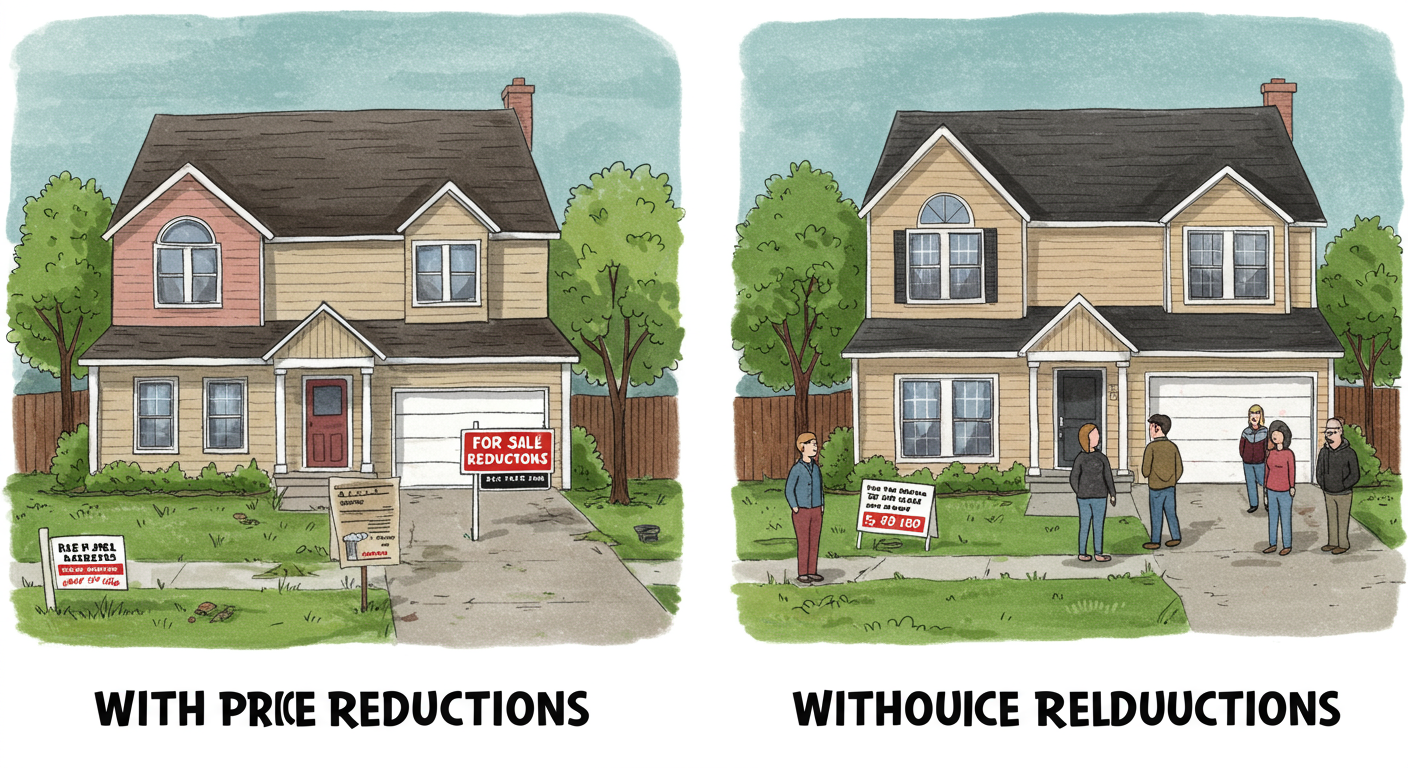
DOM Difference Between Homes With and Without Price Reductions
Average DOM also differs depending on the number of price reductions a home has undergone. This may seem obvious since homes that sell quickly don’t need price reductions. However, the data below is worth noting because it shows just how significantly DOM is impacted when a home is priced too high.
Both single-family homes and condos with price reductions spent three times as long on the market. This is compelling proof of the importance of pricing a home to sell the first time it’s listed.
As the new year begins, we remain committed to helping our clients achieve their current or future real estate goals. Our team of experienced professionals is ready and eager to talk in more detail about all of the information we’ve shared here. We welcome you to contact us with any questions about the current market or to request an evaluation of your home or condo.
Are you interested in current analytics from a different area? Contact us for your specific request!
Stay up to date on the latest real estate trends.
You’ve got questions and we can’t wait to answer them.